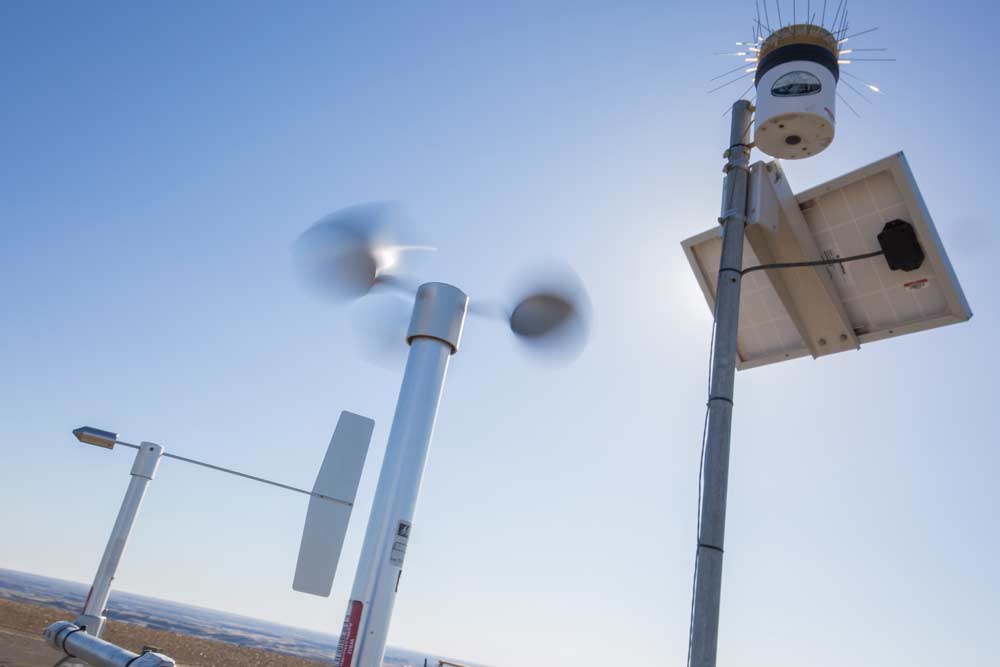
An AgWeatherNet anemometer spins from wind above a young Merlot planting northeast of Royal City, Washington, collecting data that will help predict key stages in phenological development through a new model now available to growers. (TJ Mullinax/Good Fruit Grower)
When will your Cabernet Sauvignon reach bud break? And when should you expect your Riesling to bloom?
Every season is a little different, but Washington State University’s AgWeatherNet is now tracking what this spring’s weather means for your vines.
Known as the “Grape Stages” model, the new tool gives growers an estimate of when to expect bud break, bloom and veraison for 17 varietals across 177 AgWeatherNet stations in Washington and northern Oregon.
The goal of the model is to predict phenology to help growers plan their horticultural practices, said AgWeatherNet Interim Director Melba Salazar-Gutiérrez, who led the research effort to develop the new model.
“It’s a dynamic model that changes as conditions of weather change, updating as we give it more data,” she said.
That’s important because the highly variable spring weather in the Northwest region can cause big shifts in the growing season.
For example, in 2011 Merlot vines in Prosser, Washington, didn’t reach bud break until mid-May, and they bloomed at the end of June, per the model’s data. By contrast, in 2015 bud break was recorded in early April and vines bloomed by late May.
The model is based on the accumulation of growing degree days — like many of WSU’s crop and pest models — but Salazar-Gutiérrez is still tweaking the calculations to improve the model.
Typically, GDD models add up the average of each day’s maximum and minimum temperature that’s over the base temperature of 50 degrees.
That’s just using two data points for every day, but AgWeatherNet also collects far more frequent data.
“We have the weather data every 15 minutes. So, we want to use not only the maximum and minimum but also the complete set to see if we can improve or adjust the calculations,” she said. “We know that the more data, the better the model.”
Those adjustments will take place behind the scenes this season, as more data is gathered, but the tool is available online now. It’s free with an AgWeatherNet account, just like the cold hardiness models vineyard managers may already be using.
The phenology predictions are just estimates, Salazar-Gutiérrez cautioned.
The relationship between temperature and phenological stage for each variety was determined using 23 years of weather data and the date of bud break, bloom and veraison at WSU’s Prosser vineyards.
Those relationships between GDD and phenology have been extrapolated for vineyards across the region.
“We really want you to use it and test it in order to have feedback on this model,” Salazar-Gutiérrez said when she presented her model to growers on the Washington Wine Research Advisory Committee in January. “It’s important to use and prove this tool.”
Development of the model was supported by $120,000 from the Washington State Wine Commission.
Salazar-Gutiérrez said she plans to continue to refine and validate the model, and she’s seeking additional funds for work to expand AgWeatherNet’s existing cold hardiness model to look at the risk of bud damage from unseasonal spring cold spells after vines have emerged from dormancy. •
ONLINE
Access AgWeatherNet at weather.wsu.edu
– by Kate Prengaman
Leave A Comment