A research report from Julie Tarara (above), Bernardo Chaves, Luis Sanchez, and Nick Dokoozlian
Trellis-tension technology developed by U.S. Department of Agriculture scientists to improve crop estimating in grapes is ready to be commercialized by private companies.
Estimating the yield in a vineyard is an important, though often difficult task. Accurate yield projections help ensure that enough tank space and barrels will be available to process the fruit, as it must be processed immediately at harvest and cannot be stored for later handling.
Estimating yields involves sampling cluster counts and bunch weights in vineyards, a labor-intensive task that must be completed during a short window of time. The lag phase of berry growth in grapes often is used as the trigger to start sampling because that is the period of slowest berry growth.
Lag phase occurs between the first period of rapid growth after flowering and the second period of rapid growth during ripening. Yield estimates are likely to be more accurate when sampling is completed during the lag phase because it is when berry weight changes the least.
The lag phase can be very short and the acreage to sample large, which makes yield estimation on a per-block basis a challenge. It can also be difficult to properly identify the lag phase in the field.
Berries in the lag phase are on the cusp of softening, which is ambiguous. Soft berries with slight color change already have reached veraison and are in the second phase of rapid growth, so counting such berries could skew crop estimates.
 Trellis tension
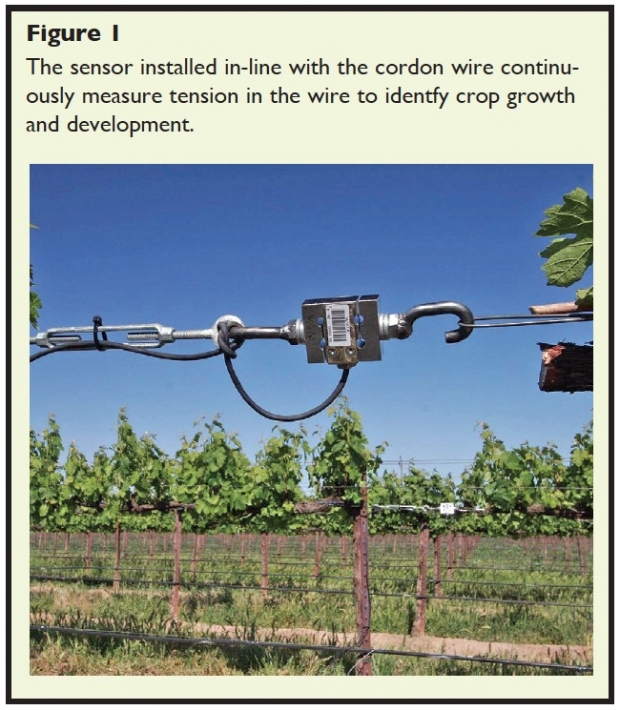
The trellis-tension technology, developed by USDA in collaboration with wine grape industry representatives, involves using an automated device (Figure 1) that continuously monitors and records tension changes in the cordon wire.
Research to measure the viability of the technology to take some of the guesswork out of identifying the lag phase was conducted in two wine grape vineyards in California in 2007 to 2009.
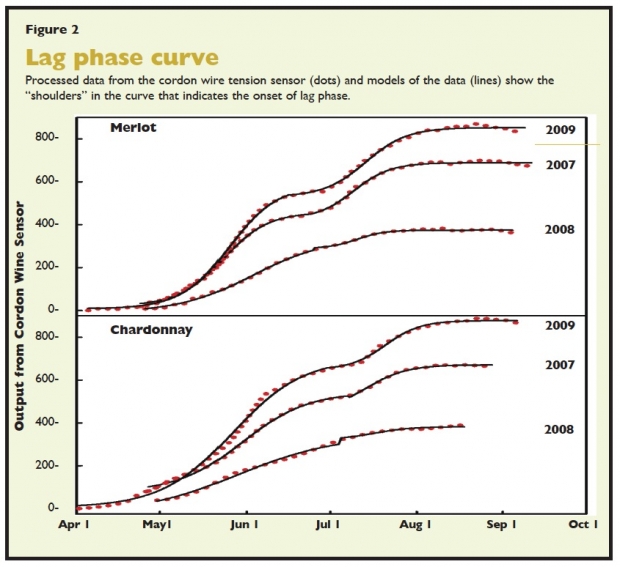
The device’s electronic output provided an indirect indication of vine and fruit growth and in most cases showed the distinctive double-sigmoid growth curve (Figure 2).
The solid lines in both panels of Figure 2 are the results of our modeling the processed tension output to make the shape of the curve clearer for a grower to identify lag phase from the data.
We defined the onset of lag phase as the first shoulder that precedes the flatter part of the curve. The second shoulder occurs well into ripening and was not part of the study.
Human vs. math calculation
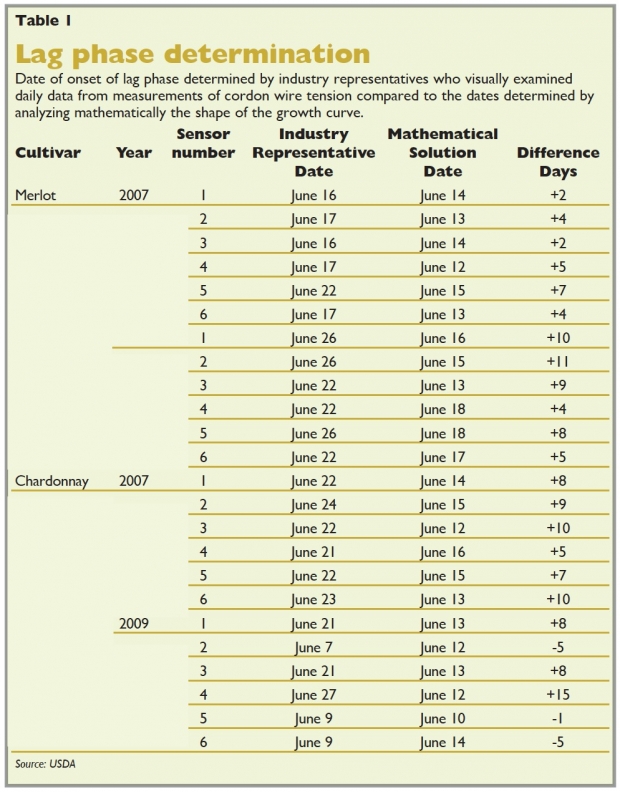
Two industry personnel examined the cordon wire tension curves visually to look for the slowing of growth in the curve and identify the shoulder. Our rationale was that if growers were to use changes in cordon wire tension to track crop growth and development, then the simplest and most straightforward way to use the information would be to look at the curves on a daily basis to find the shoulder in the growth rate.
We compared the industry representatives’ selected dates for the onset of lag phase with those identified through a calculus-based mathematical analysis of the wire tension curves.
Data for 2008 were not used in the study because the research vineyards were hit by frost about a month after budbreak, which defoliated the vines, resulting in a secondary bud break and a compressed growth cycle. This made it almost impossible for the industry representatives to find a shoulder in the curve, as can be seen in Figure 2.
Table 1 compares dates chosen as the onset of the lag phase by the two industry personnel based on the tension wire data versus dates selected by mathematical analysis of the curves. On the whole, the industry representatives selected the shoulder later than the mathematical solution, overestimating the lag phase by seven days on average.
Predictive tool
A more powerful tool would be a predictive model that could be used soon after fruit set to find where the shoulder in the growth curve is to be expected based on that season’s growth. Identifying the onset of lag phase with more precision would buy the grower time for the intense sampling that is required to cover large acreages.
There are practical consequences to estimating the date of the onset of lag phase later than it actually occurs. For example, a company will have less time to complete sampling before the berries start the second phase of rapid growth. Also, samples collected too late can result in yield overestimates because the lag phase multipliers then are used on larger, rapidly growing berries.
Our research results on the technique are available for discussion with any sensor, equipment, or engineering firms that may be interested in commercializing a product for industry use. •
For further discussion about the technology, contact Julie Tarara at: julietarara@ars.usda.gov .
Julie Tarara, U.S. Department of Agriculture, Prosser, Washington; Bernardo Chaves, Washington State University, Prosser; Luis Sanchez and Nick Dokoozlian, E & J Gallo, Modesto, California
Further reading
Tarara, J.M., B. Chaves, L.A. Sanchez, N.K. Dokoozlian. 2013. Analytical determination of the lag phase in grapes by remote measurement of trellis tension. HortScience 48:453-461.
Tarara, J.M., J.C. Ferguson, P.E. Blom, M. Pitts, and F.J. Pierce. 2004. Estimation of grapevine crop mass and yield via automated measurements of trellis tension. Transactions of the American Society of Agricultural Engineers 47:647-657.
Leave A Comment