
Troy Peters, left, checks the irrigation scheduler on his phone in a cherry orchard with Sean Hill, AgWeatherNet Web developer, and Gerrit Hoogenboom, right, director of AgWeatherNet.
Photo by Jakarat Anothai, WSU
 When do I turn the water on? And, how long do I leave it on? Although these are straightforward questions, finding good answers can be quite complex. Most fruit growers realize, however, that getting it right has big payoffs. Good irrigation water management will increase yields, improve crop quality, decrease fertilizer requirements, save pumping energy costs, conserve water, and reduce nonpoint source pollution. In short, the grower is going to be more profitable and environmental groups are going to be happy.
There are various irrigation scheduling tools available, but most of them are complicated, difficult to learn, and time consuming to use. Because of this, many growers don’t feel that it is worth the time and effort required. Many agricultural producers are also rarely in the office and don’t get many chances for deskwork. Therefore, a tool to aid in irrigation scheduling must be easy to learn and use, and should be available on a mobile platform. As Washington State University’s extension irrigation specialist, I partnered with WSU’s AgWeatherNet director Gerrit Hoogenboom and AgWeatherNet Web developer Sean Hill to develop the Irrigation Scheduler Mobile to meet these needs. The scheduler is available at http:// weather.wsu.edu/is.
Irrigation Scheduler Mobile is a free, online irrigation scheduling tool for doing simplified checkbook-style irrigation scheduling. It is optimized for use on a smartphone. It works on any platform including iPhone, Android, MS Windows Phone, or BlackBerry. Because it operates as a Web page, it also works perfectly well on any desktop Web browser. It is fully integrated with Washington’s AgWeatherNet so that daily crop water use (ET) estimates and rainfall data are automatically filled in. To maintain privacy and to keep track of each user’s data independently, each user must log in using his or her free AgWeatherNet username and password. Although currently not available, funding is being sought to expand it for use with stations outside of AgWeatherNet.
Options
Every grower using this scheduler can set up an unlimited number of fields. Setting up a field involves simply selecting the crop grown, the soil texture, and the nearest AgWeatherNet weather station for the crop water use and rainfall data. From these selections, the model is automatically populated with default values for the crop and the soil water-holding
Characteristics
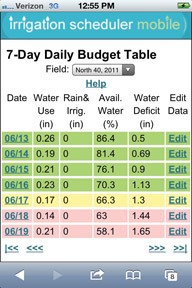
T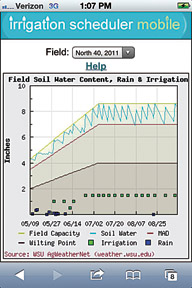 hese parameters can be fine-tuned later by educated users to improve the model’s accuracy. After setup, all the grower needs to do is add the irrigation amounts on the dates that field is irrigated. The model keeps track of the soil water content over time, and displays the soil water deficit (how much more water the soil can hold before it is lost to deep percolation) and the current percent of the total soil available water. The model can be corrected or updated on any date with soil moisture measurements or estimates. The model uses a daily time step and takes into account the effects of a growing root zone as well as the decrease in plant water use due to water stress.
The most important screens for the user will likely be the Daily Budget Table (Figure 1) and the Soil Water Chart (Figure 2). The model also outputs graphs of: the daily crop water use; the cumulative water use; the crop coefficients and root zone depth over time; the estimated amount of water lost to deep percolation; and the degree of water stress and estimated yield loss to the crop due to water stress.
Online help for each screen is available within the irrigation scheduler mobile application. A full help manual is also available online at http://weather.wsu.edu/is/ISM Manual.pdf. For additional help, or if you would like to submit any questions or comments, please contact Troy Peters at troy_peters@wsu.edu, or at (509) 786-9247.
Leave A Comment