When it comes to the diverse U.S. grape industry, who counts?
Only California and Washington, according to the U.S. Department of Agriculture’s annual survey of noncitrus fruit and nut production. As the USDA’s National Agricultural Statistics Service has sought to be more efficient with limited resources in recent years, it has reduced the number of minor producing states it surveys for different commodities.
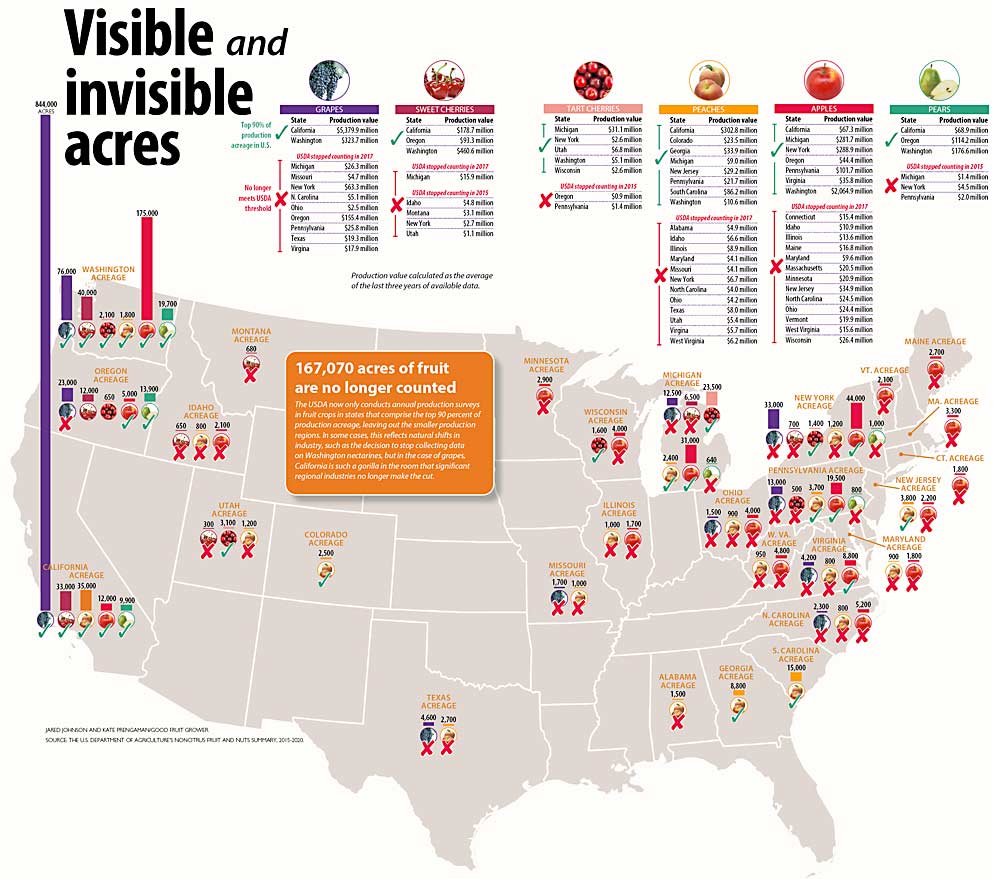
Most of the states trimmed from the survey grew a particular fruit on hundreds to a few thousand acres, such as the $25 million apple industry in Ohio, the $9 million peach industry in Illinois or the $5 million sweet cherry industry in Idaho. But when it comes to grapes, California’s footprint dwarfs the rest of the U.S. so significantly that a $155 million industry in Oregon and a $63 million industry in New York failed to meet the new NASS metric.
“They want to capture 90 percent of the national acreage. It just so happens that with California being so significant, New York’s 4 percent didn’t count anymore,” said Tim Martinson, statewide viticulture extension specialist at Cornell University. “But if (8,000) acres of apples in Virginia make the cut, and 30,000 acres of grapes in New York don’t, that just doesn’t make sense.”
Martinson said the industry relies on this type of data to understand trends, and individual growers use it to make informed planting decisions. He and his fellow researchers rely on it for grant applications, while industry groups use the stats for promotions and when talking to the media.
“You don’t know what you’ve got until it’s gone,” he said.
And lots of annual stats for tree fruit crops have gone in recent years. Following the 2017 Census of Agriculture — NASS’ most comprehensive survey of farms and acreage, but not production, conducted every five years — the agency conducted a review to make sure its efforts “get the maximum coverage with minimal amount of states … to keep costs down and ensure that we can represent as many crops as possible,” said NASS crops branch chief Lance Honig, during a virtual data users’ meeting where Martinson brought up his concerns.
After that review, NASS discontinued breaking out the different categories of processing, such as canned versus frozen or juice versus wine, and halted surveys in nine grape states, 12 peach states and 14 apple states, according to a 2019 memo. Several small pear and cherry production regions were discontinued after 2015.
It’s always a balancing act with the resources available, said Christopher Mertz, the director of the NASS Northwest Regional Field Office.
Discontinuing the processing categories, for example, actually helps the agency publish more information. If there’s only one or two processors freezing tart cherries in a given state, for example, NASS can’t publish that potentially individually identifiable data, so aggregating more generalized estimates makes sense in the face of increasing consolidation, Mertz said.
Some commodity groups, such as the California prune industry and the Oregon hazelnut industry, actually fund NASS to collect statistics that the agency wouldn’t have otherwise, Mertz said.
The Oregon wine industry used to do that, but now it funds the University of Oregon to conduct production surveys by variety. Oregon Wine Board communications manager Sally Murdoch said the reports are valued across the industry, from planting and production to marketing and grant applications.
Similarly, the fruit industry in Michigan routinely applies for state grant funding to cover the cost of contracting the local NASS office for detailed statistics on Michigan production, said Audrey Sebolt, horticulture specialist with the Michigan Farm Bureau.
She wasn’t aware of any concerns from the state’s ag groups that the annual NASS production surveys had been discontinued for the state’s sweet cherry, grape and pear industries in recent years. While it is good to see how Michigan producers rank on national-level surveys, Sebolt said the state report “goes beyond the noncitrus report, into what’s the varieties, what’s the rootstocks, how much acreage is high-density. I rely on that data more than the national when I need to get to the nitty-gritty.”
All the commodity groups work together to encourage growers to participate in the surveys, because they know how valuable the data is, she added.
In New York this spring, Martinson and Sam Filler, the executive director of the New York Wine and Grape Foundation, began raising the alarm about the discontinued surveys — including a more detailed, five-year orchard and vineyard acreage report the USDA discontinued in 2011. That attracted the attention of New York Sen. Chuck Schumer, who called on the USDA to reinstate the data collection.
“New York’s world-class wine industry deserves a level playing field, and the exclusion of the state’s grape crop from major data collection reports compiled by USDA put New York’s grape and wine industries at a distinct disadvantage,” he said in a statement.
Martinson said he understands the cost involved in surveying hundreds of wineries and the low participation rates that result from sending growers survey requests. But it seems incongruous to him that the NASS still collects data on the New York tart cherry industry, 1,400 acres producing $2.6 million worth of fruit, but not the $63 million grape industry.
“If they have to draw the line somewhere, it shouldn’t be the No. 2 horticultural crop in New York,” he said.
—by Kate Prengaman


Leave A Comment