Photos: TJ Mullinax/Good Fruit Grower;
Graphic: Jared Johnson/Good Fruit Grower)
The No. 1 lesson for avoiding bitter pit and green spot?
Crop load management.
For three years, across dozens of orchards, Lee Kalcsits and Bernardita Sallato of Washington State University studied how nitrogen, magnesium and potassium affect the incidence of bitter pit in Honeycrisp and green spot in WA 38. They aim to use their data to establish guidelines for managing the nutrient-deficiency disorders in two of Washington’s most profitable cultivars.
Nutrients matter, they determined, but their biggest takeaway was that crop load management matters more.
“Crop load accounted for more than half the variability in bitter pit that we observed in commercial orchards,” Kalcsits said in January at the Washington Tree Fruit Research Commission research review. “So, if you get crop load right, and you have the right rootstock with the right calmness to your tree, you’re going to have a good outcome in bitter pit no matter what you do on the nutrient side of things.”
They found a similar, concrete connection between crop load and green spot.
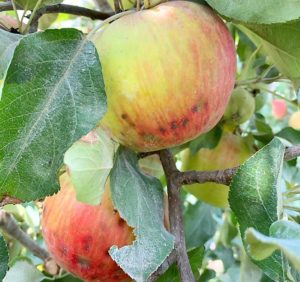
Researchers long ago determined bitter pit is caused by a calcium imbalance in Honeycrisp apples. Green spot is likely a similar, if not the same, deficiency manifested in WA 38, the WSU apple marketed as Cosmic Crisp. Both disorders have the same interconnected risk factors — high vigor, low crop load and a high potassium-to-calcium ratio.
For decades, growers have been asking for more predictable, concrete measurements to know when they should apply calcium or other nutrients, and how much they need, to avoid bitter pit. A favorite industry joke is that after 107 years, they still don’t know.
However, research papers dating back to at least 1968 have tied the disorder to crop size.
“In my mind, we do know,” Sallato said.
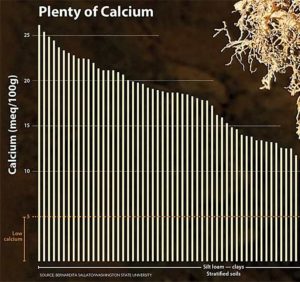
Nutrients indeed move the needle, the researchers said. The problem is that a wide variety of factors, including soil type, can skew any single measurement. For that reason, Sallato, a WSU Tree Fruit Extension specialist with a soil nutrient background, does not prescribe set ratios.
At WSU’s Sunrise research orchard near Rock Island, the two researchers and their teams applied low, medium and high levels of nitrogen, magnesium and potassium to both cultivars over many sites. Their data show nitrogen applications led to higher vigor — measured by shoot growth — and unsurprising increases in bitter pit and green spot.
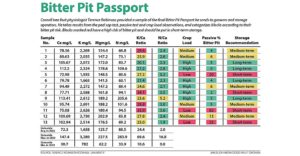
Growers have recently been asking for indices based on fruitlet nutritional analysis that they can use to set their application rates for foliar calcium or some other treatment, Sallato said. So, she and Kalcsits measured nutritional content of leaves and fruitlets in commercial orchards in June and fruit peels at harvest time, inspired by a Cornell University study that used peel sap analysis from Honeycrisp fruitlets to measure the ratio of calcium to other nutrients to help predict the risk of bitter pit showing up in storage.
In their Washington results, the ratio of potassium and magnesium relative to calcium in the fruitlets did correlate with bitter pit incidence, but there was high variability. Too much can happen between June and harvest. To get a better assessment of risk, look at crop load, which correlates strongly with bitter pit and green spot incidence, they said.
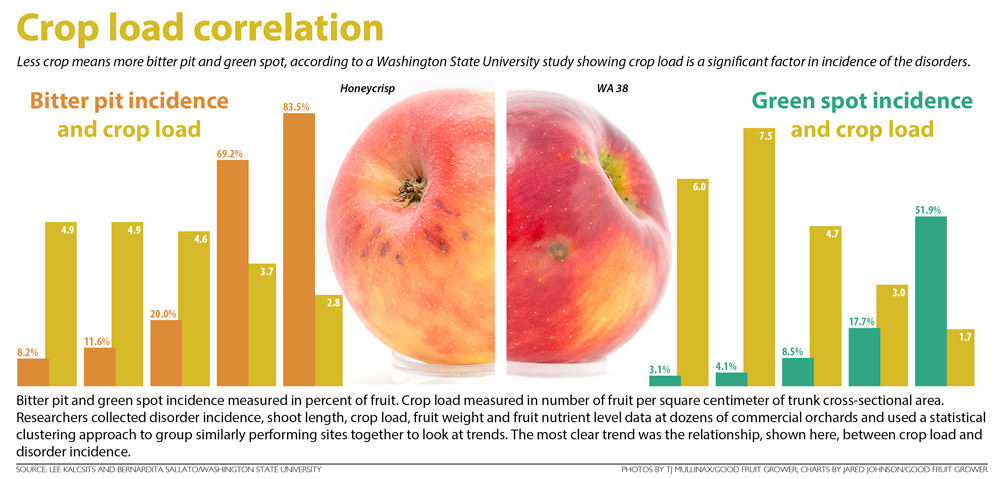
Take a look at some of their results:
In 22 commercial Honeycrisp orchards over three years, bitter pit incidence went up from 8.2 percent to 83.5 percent as crop load went down from 4.9 to 2.8 fruits per square centimeter of trunk cross-sectional area. Likewise, fruit weight and vigor — measured by shoot length — both increased as crop load decreased.
In 17 commercial WA 38 orchards, green spot went up from 3.1 percent to 51.9 percent as crop load ranged from 6.0 to 1.7 fruit per square centimeter of trunk cross-sectional area. Shoot length did not show a clear trend, though other measurements of vigor might have, Sallato said.
The researchers measured fruit calcium, potassium, magnesium and nitrogen. They found some correlation between fruit peel nutrient content and the disorders, but no clear lines that would provide a foundation for application guidelines. The fruit peel results varied with changes in management strategies and soil nutrient levels.
Kalcsits and Sallato said they are working on recommendations for Washington growers.
Matt Miles of Allan Bros. said his company subscribes to the researchers’ conclusion: Nutrition matters, but not nearly as much as crop load.
“If your stuff is out of whack, you better get it in whack,” said Miles, chair of the commission’s apple horticulture postharvest research committee. “You better get it right.”
Even if the project didn’t yield conclusive formulas for nutrient management, the work moved the industry closer to understanding the mystery of calcium imbalances, he said.
“We’re making it by inches,” he said.
—by Ross Courtney


Leave A Comment