—by Matt Milkovich
Measuring yield variability in a tart cherry orchard block has never been an exact science. For some growers, it consists of sending someone to count the number of bins and roughly gauge the distance between them — assuming there’s time to do it during a busy harvest, and assuming that whoever does it remembers to write it all down.
But with tart cherry growers struggling to make financial ends meet, consistent measurements of yield variability in their orchard blocks could lead to greater efficiencies.
A Utah State University research team is testing a more efficient way to monitor and document yields and yield variability by using technology to automate the process and integrate it into the harvest routine.
“One of the ideas behind precision management is to know the variability of your field,” said USU professor and extension fruit specialist Brent Black. “If part of a field isn’t very productive, maybe you don’t plant trees there, or maybe you manage them differently.”
Black is leading the effort to develop a yield-monitoring system for tart cherries — part of a four-year, $2 million research project funded by the U.S. Department of Agriculture’s Specialty Crop Research Initiative to optimize management practices for tart cherry orchards.
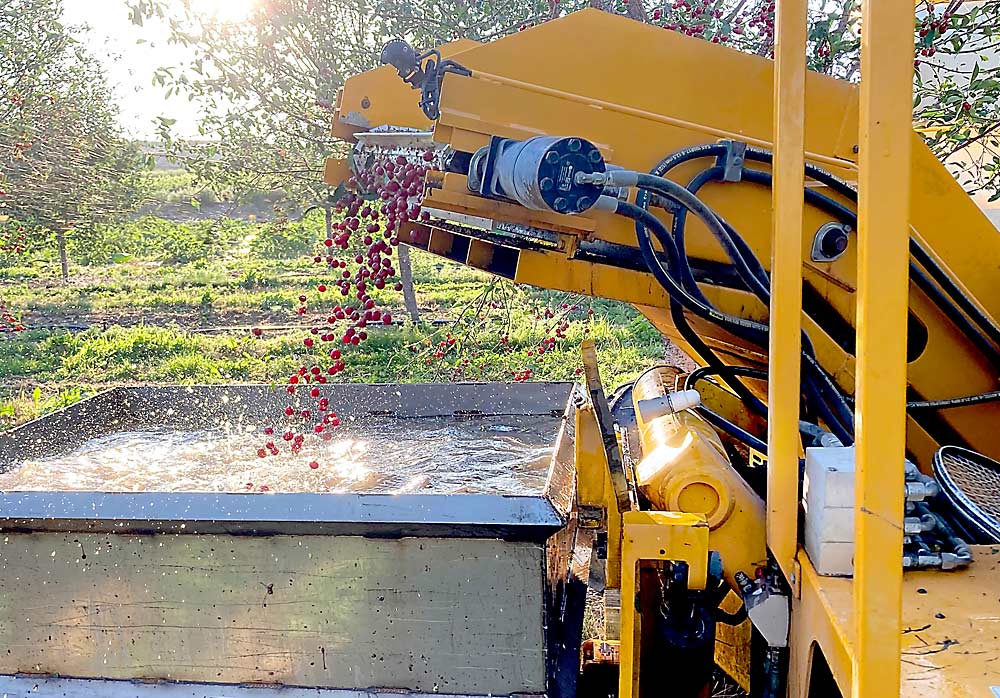
The system the USU team designed resembles the yield monitors found on grain combines more than it does the camera-based vision technologies that count individual fruits in high-density apple orchards. It consists of three parts placed in different locations on a mechanical harvesting receiver (the half that collects the cherries; not the shaker): a proximity sensor, a GNSS antenna and a plastic box containing a computer, said Anderson Safre, the graduate student who designed the yield monitor.
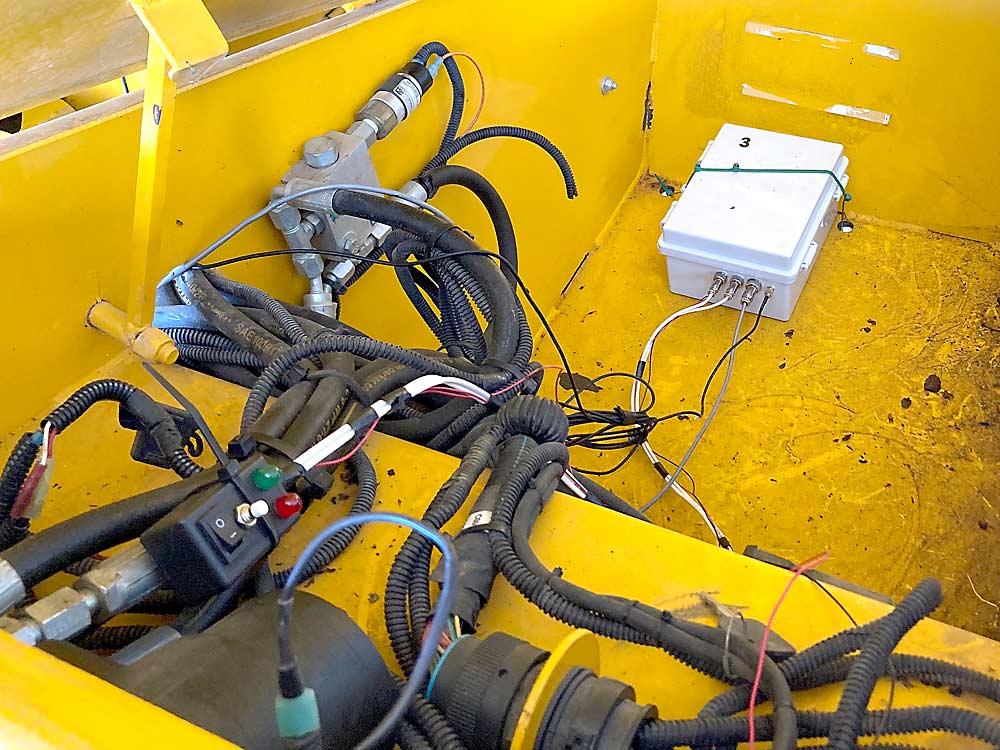
The sensor, placed near the bin loader, uses sonar (sound waves) to detect when a full tank is placed on the ground. The GNSS antenna marks the time and precise location, and the computer records the data. Fruit yield is calculated based on the distance between each tank.
The first version of the yield monitor was a mechanical, spring-loaded arm. The arm kept breaking, however, so Black tasked Safre with a redesign. Safre used low-cost, off-the-shelf components in the new version, which can be built for less than $400 per unit, he said.
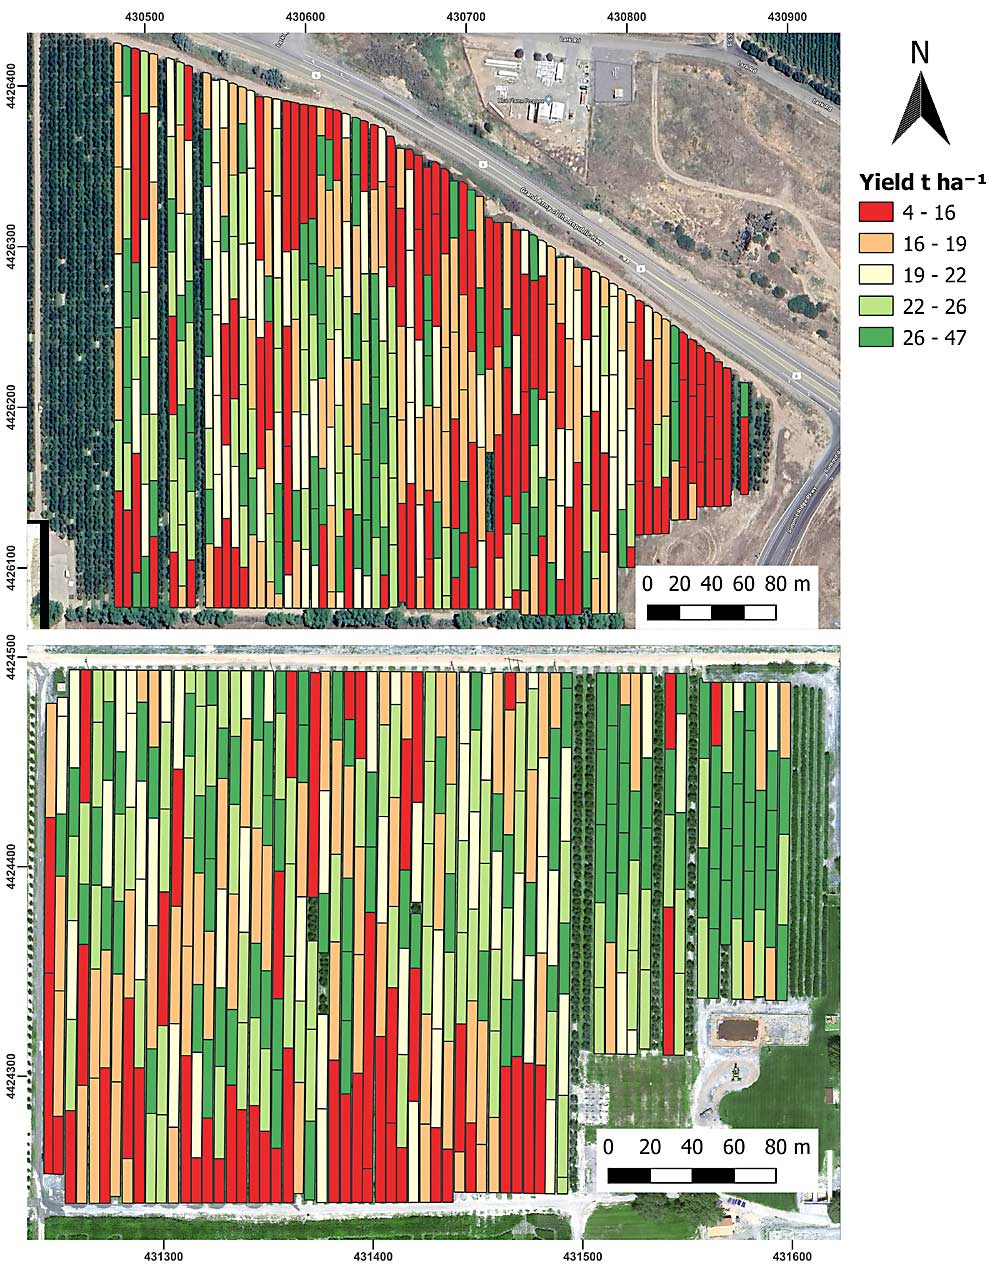
They trialed the current design in Utah orchards last year and found that the monitors provided reliable measures of yield variability. Grower Marc Rowley, who participated in the trial, said he uses similar yield-monitoring technology on his wheat and alfalfa harvesters. The information helps him fine-tune his production decisions, which can only help his bottom line, he said.
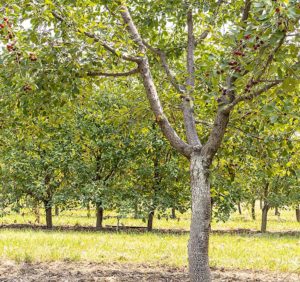
The yield-monitoring system has to correct for vagaries in the tart cherry harvest process. Mechanical harvesters grab a cherry tree by the trunk and then shake it until the cherries fall off. The fruit lands on a canopy and is conveyed into a water-filled tank. Any system that monitors yield variability must account for tree spacing, the volume of cherries in the tank and the location where the operator chose to drop the tank, according to the USU researchers.
GPS signals can be spotty in orchards, Safre said. He would prefer to use more precise GPS tech in the yield monitors, but that would be more expensive, and they want something farmers can easily adopt.
Yield monitors can be attached to harvesters with little trouble. Black would like to see them integrated into new machines one day.

The monitoring system can also be used to track the progress of harvest crews. The only labor required is someone to go through the data after harvest, Black said.
Safre is also pursuing a computer vision system that could measure the total amount of fruit per tree by counting the number of cherries crossing the harvester conveyor belt, but that system remains in an early stage of development, he said.
The research team will conduct more trials this year, in Utah and Michigan. Ten monitors will be trialed in Utah and five at Michigan’s Cherry Bay Orchards.
Cherry Bay orchard manager Emma Grant looks forward to trialing the yield monitors. Processors are always looking for yield estimates, she said, and greater knowledge of yield variability helps with labor management.
“As labor costs go up, it would be nice to have a better idea of crop load from year to year, so we know how many people to bring in for harvest,” Grant said. •


Leave A Comment