Growers know the risk that cold temperatures pose to blueberry buds depends on the plants’ cold hardiness: In the winter, cold temperatures are rarely a concern unless it’s really cold. But in the early spring, as buds swell and temperatures fluctuate, mitigation may be necessary to prevent crop loss.
That mitigation is expensive, considering the costs of propane for wind machines and heaters, as well as labor and equipment. Modeling cold hardiness and how it changes throughout the season gives us a more educated approach on cold management, considering both the local weather conditions and the variety.
With funding from the Washington Blueberry Commission, a Washington State University team recently developed a cold hardiness model for specific blueberry cultivars that is now available on AgWeatherNet. Growers decided to prioritize Duke and Liberty models, which are now available. Data collection needed for Draper and Aurora models will finish this year.
The data collected to build these models is the lethal temperatures at which 10 percent, 50 percent and 90 percent of the flower initials in the buds die. We gather this data by collecting hundreds of bud samples from October through April in Prosser and Mount Vernon. We freeze them at 10 different temperatures before dissecting the buds to evaluate the damage.
The model
Our freeze data was used to create the model that can be found by signing in to AgWeatherNet (AWN) at weather.wsu.edu. Under the “models” tab, you’ll see cold hardiness models available for grape and blueberry, while cherry is under development. You can add the name of the weather station closest to you, either geographically or climatologically, then select the season and the cultivar.
The blueberry model has a blue line, which shows the minimum temperature each day, and three additional lines for the lethal temperatures: LT 10, LT 50 and LT 90. The goal of these models is to help predict how cold-hardy the blueberries are in the field. Ideally, to avoid freeze damage, the blue temperature line should never get close to crossing the lethal temperature lines below. The lethal temperatures in this model currently have a degree of error of 4.5 degrees Fahrenheit. If the temperature line is close to the lethal temperature lines, you know you need to go out and mitigate for cold temperatures coming through.
It’s important to understand that preceding temperatures make a big difference. For example, data from a specific January day in Prosser and Mount Vernon, show an LT 10 in Prosser of minus 9 degrees F, while in Mount Vernon, the lethal temp on the same day is 1.4 degrees because the preceding temperatures are warmer. Western Washington is warmer generally, but that can leave buds susceptible to damage during a sudden cold spell. Likewise, there may be a temperature difference from your site versus the closest AWN weather station. If you are colder than the closest AWN station, then you may be more cold-hardy — or less cold-hardy if you are typically warmer.
Remember this is a mathematical model, based on years of data, trying to estimate hardiness with temperature from AWN stations. Use it in conjunction with historical data from your field and current field visits. It can help you to decide when to turn on fans and heaters, but it should also prompt you to assess actual field damage if temperatures are very cold.
Assessing damage
To look for cold damage in your own field, make sure you are collecting shoots from representative parts of the field. A “zone” for collection should be the same cultivar and elevation. If the block has areas with differences in elevation, think of that as different zones to collect samples from — even if it is the same block. This is because cold air often settles at the bottom of a hill, potentially creating temperature differences and, thus, differences in damage from the top versus the bottom of a hill.
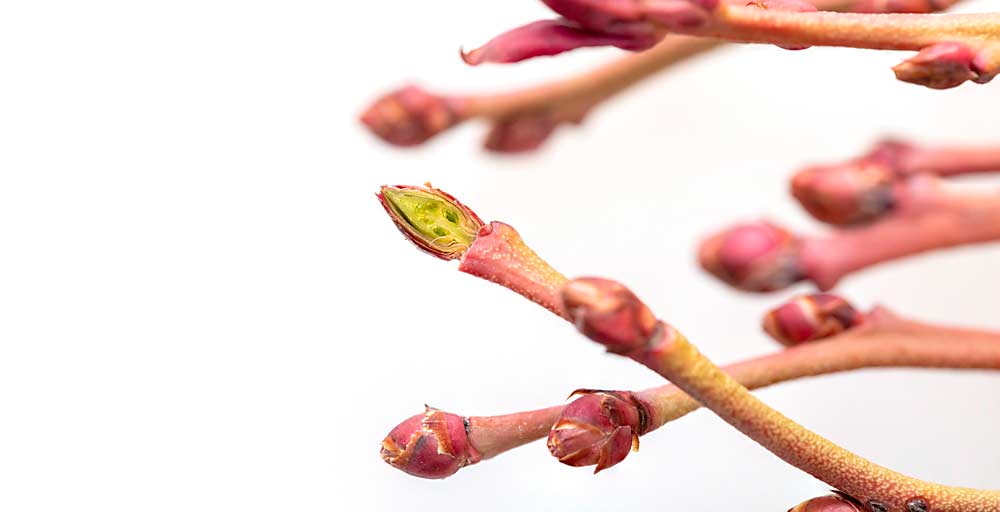
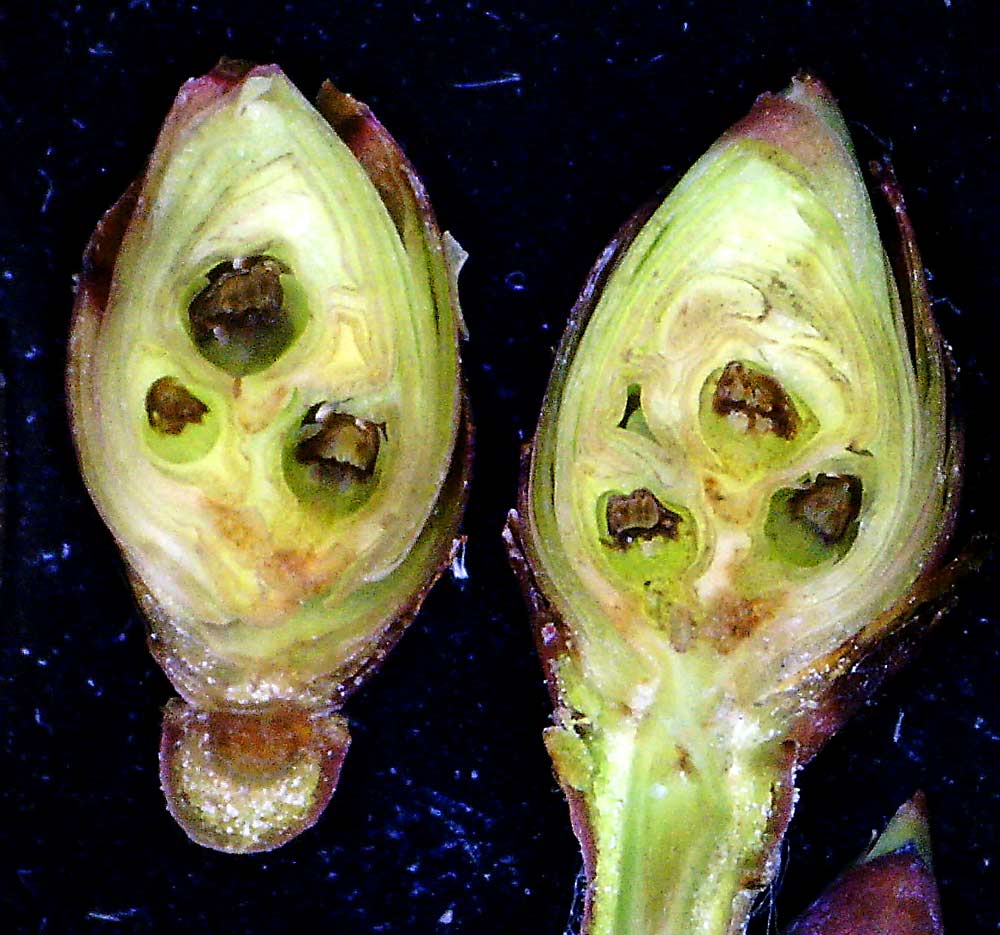
Collect 100 shoots from each zone and then cut the top two fruiting buds at the shoot tip. When sliced, healthy flower initials are plump and green, resembling a round ball. Brown spheres indicate death. Inside a blueberry bud, you may have anywhere from 4 to 10 flower initials. The flower initials are formed in a whorl, so a single slice of the bud will not allow visualization of all the flower initials.
For research, we spend several minutes per bud and slice away all the individual leaf scales to see every flower initial. However, for an overall field assessment of damage, more shoots can be taken (n=100) and a quicker cut from the tip to base of each bud can often reveal 70–80 percent of the flower initials. Because of this ease and the large number of fields that may need to be assessed, we recommend cutting in this manner and recording the total number of flower initials and the number of dead per bud. An estimate on damage can then be calculated. Lastly, the vascular tissue at the base of the bud can sometimes appear dull green or brown. Vascular tissue is regenerative, so even if it is slightly off-color, that bud should be assessed for damage by inspection of the flower initials.
What’s next?
One area of the research that went into developing the model: better understanding how much data is needed to reliably predict lethal temperatures of blueberries.
If we just have three data sets (a data set being all the data collected from one field in one season) the mean LT will have a wider range of error, making it less accurate. Ideally, with 12 to 15 data sets, the range of error is reduced to approximately 0.5 degrees Celsius; beyond that, more data sets don’t further reduce the error in the model. For additional cultivars, 12 to 15 data sets will be needed to be included in the AWN model. However, there is additional error associated with the way the model is built, and one of the next steps in this research is to improve the model design.
Initial evaluations have found that the different blueberry cultivars have different cold hardiness, and location makes a difference. Colder sites can drop into cold hardiness faster but can be more at risk during a spring frost event. Looking over the past seasons of data, we rarely see damage in the fall. More analysis on specific cultivar differences and seasonal variation needs to be conducted and shared with producers. We will be asking the industry about their next need: more cultivars, more cooperation with breeders, mid-winter hardiness, better temperature estimates, etc.
This work has been led by myself, Lisa DeVetter (small fruit horticulturist at WSU) and Clark Kogan (statistician at WSU). The detailed bud-cutting data has been conducted by a dedicated group of technicians, including Allyson Leonhard and Maia Blom in Prosser and Sean Watkinson in Mount Vernon.
—by Gwen Hoheisel
Gwen Hoheisel is Washington State University’s regional extension specialist for tree fruit, grape and berry and the extension director for Benton County. She can be reached at: ghoheisel@wsu.edu.


Leave A Comment