Editor’s note: Growers today are inundated with technologies promising all sorts of solutions. But how do growers evaluate what will work best for their farms and their needs, versus chasing the shiny and new? Good Fruit Grower introduces an occasional Tech 101 feature, where we hear from industry-leading experts about the benefits and pitfalls of new tools and what questions to ask salespeople and service providers to ensure you get the best solutions for your farm.
Ste. Michelle Wine Estates of Prosser, Washington, has been using remote aerial sensing since 2004 to help monitor vine health, plan differential harvest and even map out new vineyards. Good Fruit Grower recently sat down with Jenn Smithyman, precision agriculture specialist for the company and one of Washington’s vineyard technology experts, for a primer on remote sensing, how her company uses it and how other growers can deploy it. The conversation has been edited for clarity.
How does Ste. Michelle Wine Estates use remote sensing?
We use NDVI. This gives us an indication of the health of the canopy, because plant leaves absorb visible light for photosynthesis and reflect the near-infrared light. The NDVI index indicates leaf mass and health of the canopy.
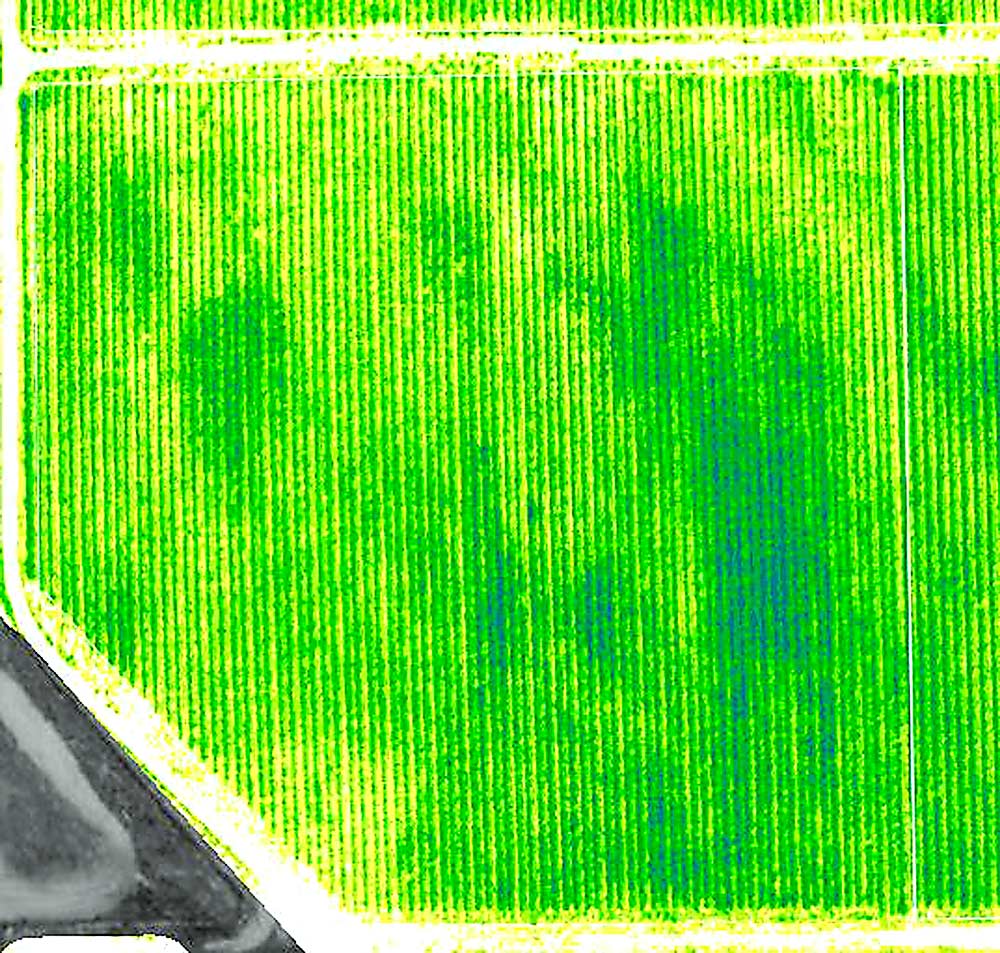
(*Pointing to an aerial map — see Image 1). There was earth-moving in that dark area. Every year I will get a higher NDVI value there because of the deeper soils. These little dark spots here are emitters that are leaking and allowing too much water. We also have some lower NDVI values, where the map is lighter. In the case of this particular block, it’s a very shallow, rocky area.
Throughout the season, every two weeks, we’re getting an image taken in this particular location. I can go back through and look in the past, and we can make comparisons with the most recent images. For example, at the end of July and early August, we really want to get ahold of the canopy. We don’t want any more canopy growth because we want the plants to focus on the fruit ripening.
We’re working with some remote sensing service providers to create a process that will allow us to subtract one image from another so we can highlight where the canopy is still growing or where we have control over it.
In these NDVI images, each pixel is 10 centimeters. It’s a calculated value, a number from zero to one. If I subtract August 15 from August 1, I would want it to be zero. If it’s coming through as a positive number, then we have a lot of growth happening, so we need to address the reason for the continued growth.
We’ve used remote sensing over open ground to plan and design new vineyards, like our vineyard on Red Mountain. We used a combination of GIS (geographic information system), multispectral imagery, ground penetrating radar and dug dozens of pits to view the soil profile. We used that data, combined with slope, wind and solar exposure, to design the unique row orientations that we have at Col Solare.
NDVI isn’t really new, is it?
NDVI has been around for a very long time. NASA used NDVI-sourced images from satellites in the 1970s to measure green mass in the Great Plains and later in studies to identify phylloxera in California grapes.
What are the different indices?
There are many indices, but NDVI and NDRE are the most widely used in agriculture. NDVI (Normalized Difference Vegetative Index) is calculated from these individual measurements: Near-infrared minus red over near-infrared plus red. It takes specific wavelengths, near-infrared and visible red, resulting in a numeric value.
NDRE (Normalized Difference Red Edge) is similar to NDVI, however it utilizes the edge of the red band, which penetrates farther down into the canopy. The equation is near-infrared minus red edge over near-infrared plus red edge.
In a lot of crops, NDVI values can saturate. For instance, you may get a 1.0 on an NDVI scale of 0 to 1. At this point there is no useful information from NDVI, and that is where NDRE becomes useful. We don’t typically get saturation in Washington wine grapes because we control so much with irrigation. A heavy canopy for most of our varieties is a 0.6.
NDRE doesn’t saturate on the very top of the canopy. The red edge can take into account more of the canopy underneath, so it gives you a little more idea of plant health where NDVI saturates.
We’ve looked at NDRE for our grapes but have decided it’s not giving us any more useful information — at least not that we have identified yet.
Would NDRE make sense in tree fruit, where canopies are denser?
I would think so. There are also uses for it in corn and forestry, based on what I have read.
Does NDRE give higher resolution?
This is different than resolution. The resolution of NDVI and NDRE can be the same. Resolution is related to flying altitude and equipment used to capture images. The difference between multispectral and hyperspectral are the wavelengths captured. Multispectral captures five bands. Hyperspectral captures more specific wavelengths.
What about thermal imagery?
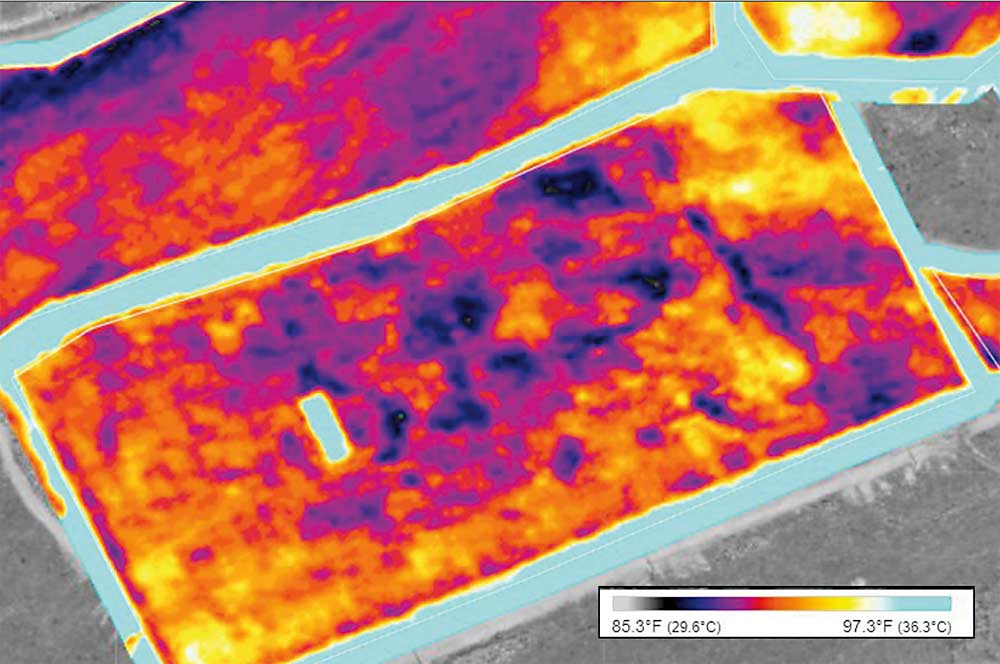
We do use thermal imagery. You can identify where you might have some hotter spots, which might be related to plant stress. You can see in this July image (see Image 2) there’s a hot area. There’s bare ground (in blue) where we have a tank located. These colors indicate levels of heat and the legend indicates the actual temperature. We’ve been using thermal imagery mostly for research purposes, looking at frost, cold spots and air drainage areas. We have also used it on machinery to determine hot areas that might indicate a part needs to be replaced.
What do the colors mean?
Each service provider will set “colors” or determine the scale used to represent NDVI values or NDRE values. That is why I caution growers to know what these colors mean. I could make this whole map shades of yellow and it would look more uniform than it really is, or I could make it from yellow to black and make it look even more variable. So, you need to know what the numbers are behind the color. We have standardized the symbology that we use; it has been the same since 2004 so that we can identify issues very quickly, without having to dig out the specific values.
You said growers should clarify their questions before investing in remote sensing. What kinds of questions?
They might have questions about how efficient their irrigation system is. If they have a lot of variability, then they can adjust irrigation design, run double lines, change emitter size, that kind of thing.
If you have areas of heavy canopy and light canopy, you might want to adjust to create a more uniform block. There’s a reason you have lower vigor. Is it irrigation? Is it a disease? Is it phylloxera? Topography? Imagery can’t take the place of “ground truthing” and knowing your vineyards, but it’s a great tool to identify areas that need more focus. In some vineyards, we will capitalize on variability with differential harvest.
What changes are in store for the future?
NDVI and NDRE are calculated from multispectral imagery, which is the current standard. The hyperspectral technology (looking at many more wavelengths of light) is fairly new in agriculture. Researchers hope to use it to identify specific pests and viruses. For instance, leaf roll. What wavelength (can detect) it? We don’t know yet, but there are a lot of research groups working on these types of answers. I think they’ll get there. It’s going to take a lot of work and it’s likely going to vary by variety and species, but it’s going to be an amazing breakthrough.
Also, if regulations loosen up on drones a little bit, drones will become more useful. Right now, it takes two people to fly a drone. Battery life needs to improve. Vendors can only fly 20 or 30 minutes or so. When we’re imaging a couple thousand acres in a day, we would need a lot of drones to be able to cover that.
How do growers calculate cost benefit?
Again, it really depends on the questions that they’re looking to answer. Maybe they want to improve their irrigation efficiency. Irrigation is the biggest tool we have in this region. We can really control the vine growth. A reliable, efficient irrigation system is key.
I often wonder if growers can use sensing to market their grapes to specific winemakers or wineries. They can look at a block with variability, identify the flavors in that area and market that. Maybe that’s too far out there ….
A lot of these things growers won’t be able to fix, so why not capitalize on what they can manage and increase their profits that way? I think there’s a lot of out-of-the-box thinking that we can do. That’s the fun part of it.
—by Ross Courtney
Related:
—Applying precision agriculture to tree fruit
—Khot: Drone data for agriculture
—Mullinax: Are you ready for liftoff?
—Oregon viticulturist tests, uses drone technology — Video
—Ag drone future’s up in the air — Video


Leave A Comment