Spatial data-driven farming isn’t just for large growers who can afford the latest technology.
A new online mapping tool developed as part of the Efficient Vineyard Project — a five-year, federally funded research effort to develop sensor-driven, variable-rate management strategies for vineyards — offers a free tool to growers who are spatially curious and want to dip their toes into mapping their management.
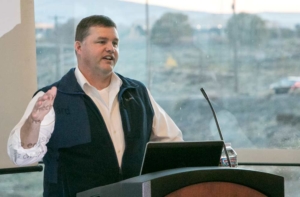
Efficient Vineyard Project leader Terry Bates, director of the Cornell Lake Erie Research and Extension Laboratory, CLEREL, located in the grape belt that stretches along the big lake in Western New York and Pennsylvania, said the new tool should be an accessible first step.
“My intent is not to replace ArcGIS or AgLeader or Trimble products; my intent is to give the general grower a ‘gateway drug’ into using this technology,” he said. “We said, ‘Let’s build a platform to get them interested and using spatial data, and if they are having success with it, they can go to these more sophisticated platforms.’”
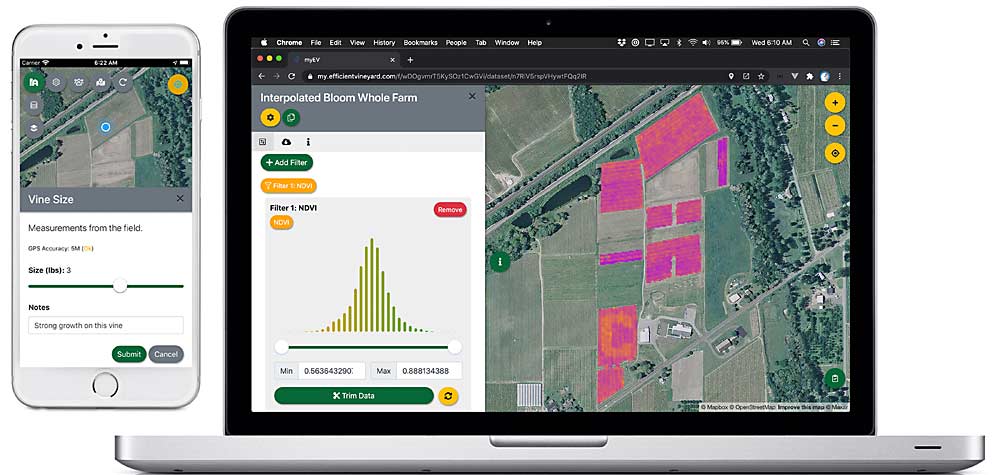
The mapping tool, found at my.efficientvineyard.com, automates some of the data processing work the staff at CLEREL was doing manually for local growers who borrowed the lab’s Normalized Difference Vegetation Index, or NDVI, sensors during the research phase of the process, Bates said. That will free up his spatial data technician, Rhiann Eckstrom, to take on new research.
Though the $5.9 million Efficient Vineyard Project concluded in 2020, many aspects of its “measure, model, manage” approach will continue with a new variable-rate management research project focused on sensor development for grapevine nutrition, another project developed with seed funding and support from the National Grape Research Alliance. And from an extension perspective, Bates wants to make sure smaller growers have the support they need to adopt the technology.
In general, larger growers tend to be the early adopters of new technology, but large and small growers can benefit from using spatial data, he said. For example, on the myEV platform, growers who don’t invest in variable-rate equipment can still make precision maps that farmworkers can access on their phones, Bates said.
“Having something that’s simple and easy and accessible to them is important to me. I started off making it for the small guys,” he said.
One of Bates’ earliest grower-collaborators, Thom Betts, considers himself one of the small guys. He and his parents farm 185 acres of juice grapes, and in recent years he has incorporated spatial data into all of their management decisions.
“We’re not doing extra things, we’ve just integrated everything we are doing with precision technology to make better decisions,” Betts said. “We use spatial data for every single stage of the growing season.”
For example, in 2020, a spring frost hit the Betts’ vineyard. NDVI maps showed where the damage was, so they saved money by reducing fertilizer applications in the areas where they lost the crop.
Broadly, Betts said, spatial data helps “increase the productivity of your less profitable areas.”
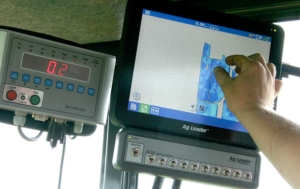
But he hasn’t used the new myEV platform. Betts started using AgLeader technology — designed for row crop growers — several years ago to link yield data, NDVI data and soil data into variable-rate thinning and fertilizer plans.
“It’s an addictive thing when you get into it,” he said. “It changes our mentality in farming — you are no longer doing every acre by the seat of your pants.”
He recommends that growers who are interested in dipping a toe into spatial data start with one objective that makes the most sense for their farm, and find a mentor.
When it comes to the 80 or so people already using myEV, Bates said everyone seems to be using it a little bit differently. The site has users in every major U.S. grape region, and they are mapping virus-infected vines, adding pruning weight observations and including NDVI and yield monitor data, if they have those technologies.
“It’s a platform for visualizing spatial data, and that data is whatever you want to measure in the vineyard,” he said.
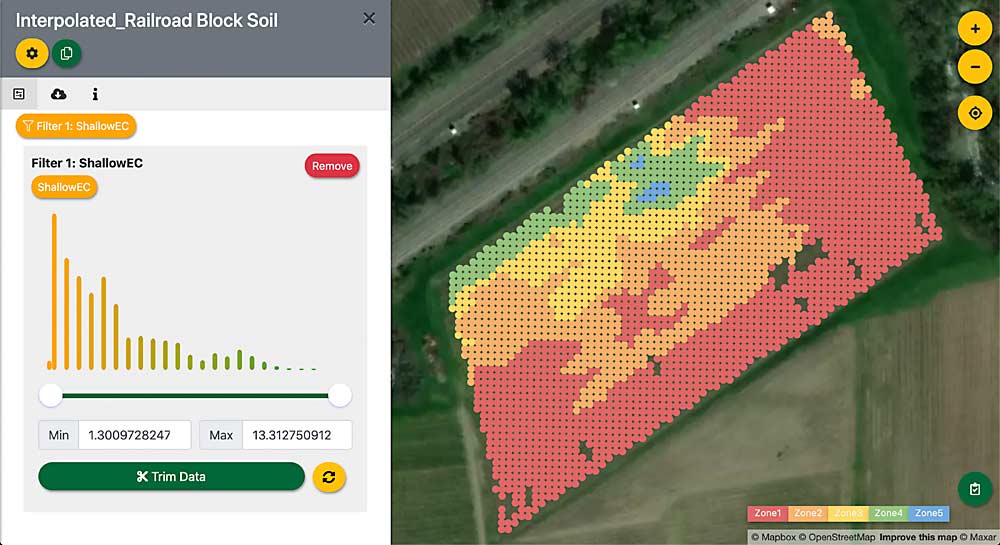
The platform is still evolving to add functionality, and he is looking for new funding to sustain the effort. As of early 2021, users can define their farm blocks, import spatial data, visualize the data, interpolate and integrate the data — processing it so that different types of information can be shown on the same grid and help them understand interactions. Next steps include helping growers translate sensor data through strategic in-field calibration and generating management maps.
“So, if I have a soil layer, a pruning-weight layer and a yield layer, I can export that and it will do a cluster analysis and give me the zones that are statistically different,” Bates said. Right now, that analysis has to be done manually, but over the next year, his team will build the tools for myEV to automatically create that zoned management map. •
—by Kate Prengaman


Leave A Comment