The U.S. Apple Association recently launched Newton, an online database and dashboard of apple-related statistics, at its 127th annual industry Outlook conference in mid-August.

USApple is the national trade association representing all segments of the apple industry, from growers to packers to sellers. Members include more than 26,000 U.S. apple growers as well almost 3,800 business entities up and down the U.S. apple supply chain.
Like many trade associations, USApple provides valuable resources for its membership through networking, advocacy, education and research efforts. One such effort, Newton, is the culmination of nearly two years of development to digitize USApple’s own proprietary data sets and consolidate data from outside sources such as the U.S. Department of Agriculture.
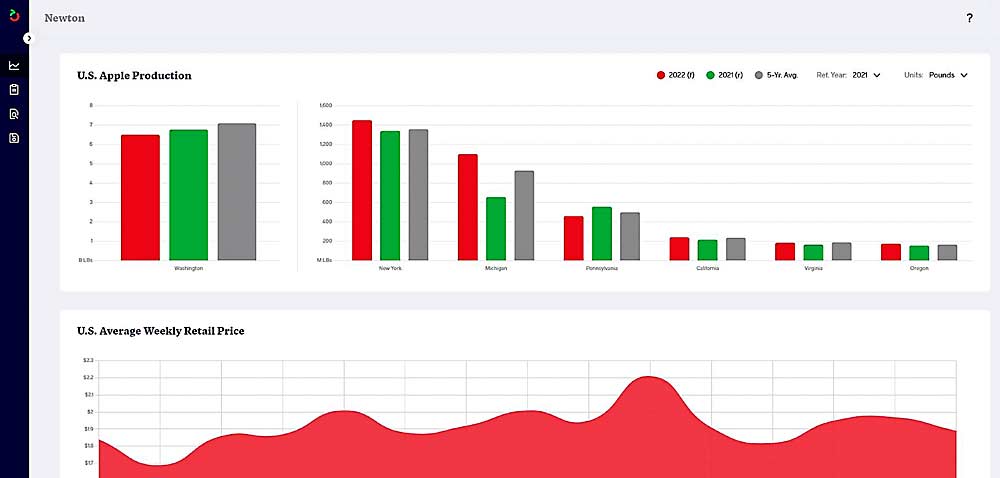
Newton is intended to be an up-to-date, one-stop shop for all apple-related statistics. Users can choose from several preset reports or create custom queries for download on topics including apple production, utilization, trade, prices, storages, movement, economic impacts and more. Newton’s dashboard is intended to keep users informed on the latest trends affecting the apple industry by graphically displaying the industry’s most frequently utilized data points for pricing, trade, storages and other statistics.
This significant member benefit will allow users to ask questions and test theories, providing unbiased insights into important apple-industry trends.
How has production shifted across varieties in the past 10 years?
Which states are expected to be short this season?
Was last year’s movement rate on par with the five-year average?
Newton has the answers.
Users can quickly and easily download their data into a spreadsheet for further analysis and sharing. Newton also allows members to save frequently viewed reports and custom queries, automatically updating the underlying data as it becomes available.
Newton Mark I
Since 1993, USApple has been surveying U.S. storage facilities to determine how many apples are left as the season progresses. As of the latest crop year, the survey went out to nearly one hundred storage facilities (across 16+ states) and two state apple associations (Washington State Tree Fruit Association and Michigan Apple Committee), capturing around 95 percent of total U.S. holdings.
Respondents to this monthly survey indicate the number of bushels that remain in their storage facilities by variety, by use (fresh versus processing) and by storage type (regular cold storage versus controlled atmosphere). USApple aggregates the data by state and releases monthly reports between November and June, detailing the U.S. domestic supply situation.
This means that, for any given month, there are 3,888 unique data points across four dimensions: 18 regions; three uses; three storage categories; and 24 varieties. After factoring in eight months of data over 30 years, USApple’s one-of-a-kind U.S. storage survey data set contains almost
1 million discrete data points.
In addition to that, the difference between one month and the next is referred to as movement and tells the industry something about the rate of drawdown. Adding all the calculated movement to the holdings data brings the data point tally up closer to 2 million.
Given how closely the industry monitors domestic supply, this data set alone may have been worth the time and expense of developing Newton. But there was no reason to stop there. From the start, Newton was designed to be flexible enough to accommodate data from any number of sources. One obvious place to start was the USDA.
The USDA encompasses several different agencies that collect and report data pertinent to the apple industry. The National Agricultural Statistics Service (NASS) has production and utilization data; the Foreign Agricultural Service (FAS) has data on trade; the Agricultural Marketing Service (AMS) has data on prices; the Economic Research Service (ERS) has income and expense data; and the Risk Management Agency (RMA) has data on crop insurance.
For this initial phase of development, Newton has been linked to select data sets in NASS and FAS via an application programming interface that automatically imports the latest data as they become available.
Newton Mark II
Not wanting perfect to be the enemy of good, USApple released Newton with many, but not all, available apple-related data sets. The plan is to continually add to and improve the dashboard and database as time (and budget) allows.
For the dashboard, future iterations will likely include additional visualizations and enhanced functionality, allowing users to manipulate data in real time. These features may let users adjust time scales, add or remove comparable data categories, change units of measure and more. The next version may also include multiple dashboards, each focused on a unique aspect of the industry, from price to trade to holdings. It may also be useful to give users the ability to create their own custom dashboard(s) that they can tailor to their individual region, varieties and markets.
For future iterations of the database, the possibilities are endless. Of course, linkages are planned for the remaining USDA sites (AMS, ERS and RMA), but the industry also relies heavily on data from global entities such as the United Nations’ Food and Agriculture Organization and the World Apple and Pear Association. Now that the architecture has been built, adding one or a hundred new data sets is a relatively simple process.
As part of the initial scope of work, USApple requested that there be some way to track which data sets were being downloaded, and how often. Using Google Analytics to provide those insights will be invaluable for future iterations, as USApple continues to add more of what users like and less of what they don’t.
Information is power. Newton unlocks that power by allowing members to freely engage with the vast amounts of data provided by the U.S. apple industry. In so doing, savvy users can identify trends and opportunities that help them succeed in a competitive global marketplace.
—by Chris Gerlach
For more information about Newton and the data contained within, contact Chris Gerlach, USApple’s director of industry analytics, by email at: cgerlach@usapple.org.


Leave A Comment