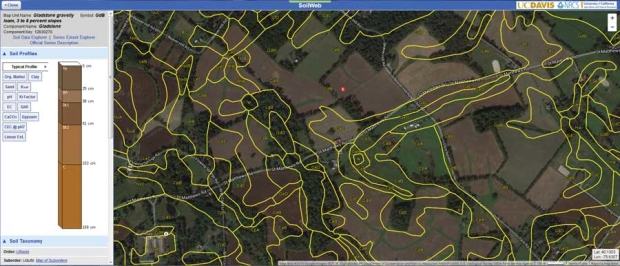
Clicking within the yellow boundaries anywhere on this SoilWeb map provides a report similar to the one on the far left side of the screen. Clicking on the boxes in the report will show graphs and charts illustrating the range of numbers for each of the soil characteristics typical of the profiled soil. (Courtesy UC-Davis)
Growers who want to expand and need more information about the soil underfoot have some key resources available with soil mapping tools for anyone with a smartphone, tablet, desktop or laptop.
Some of the mapping tools are free.
The tools provide accurate information about what a land parcel can and cannot deliver, with data derived from two of the federal government’s more comprehensive, publicly funded soil survey projects.
The first task in assessing a parcel’s potential usually begins with soil tests, which can take a considerable amount of time.
Researchers at University of California, Davis aimed to ease that load with SoilWeb (, an application capable of mapping the soil to depict soil type and provide profile information, soil taxonomy, erosion ratings and soil fertility.
Dr. Toby O’Geen, a UC-Davis Cooperative Extension soil resource specialist, and Dr. Dylan Beaudette, now of the U.S. Department of Agriculture’s Soil Resource Service, developed it at the UC-Davis California Soil Resource Lab three years ago from data mined from USDA’s National Cooperative Soil Survey.
“Traffic to the site totals 500 to 1,000 visits a day,” O’Geen said.
Although the information provided by SoilWeb isn’t a substitute for a soil test, the program can deliver preliminary data in the form of geographic, system-positioned soil profiles in an instant.
Originally, it was a standalone mobile app. “Mobile operating systems were changing so quickly we had trouble keeping up with new versions. It became too costly, so we migrated it back to the web,” O’Geen said.
Now it can be accessed via a website (bit.ly/1MxM2LH), with three components based on national data and one limited to California. All are accessible by desktops, laptops, tablets and mobile devices.
The original app, SoilWeb, provides a description of the soil either underfoot, by map coordinates or street addresses. It also supplies soil information for adjacent areas. Clicking through soil types yields graphics on the mineral content, pH, drainage, organic matter and other data.
“The new SoilWeb essentially uses aerial photo images from Google Maps with soil survey map overlays that click through to soil data and properties in an interactive display,” O’Geen said.
SoilWeb Earth, the second program, uses Google Earth to display SoilWeb data in a 3-D geographic display.
The other two apps, taken together, provide information allowing California growers to select the best possible site for an orchard or a vineyard, based on soil types and characteristics.
Soil Series Extent Explorer allows users to input soil types to see where they occur throughout the country.
It depicts the number of acres with that particular soil type on a map of the United States as well as the soils that usually occur with them.
In the Soil Properties App, users can click on various land characteristics — soil holding capacity, drainage class, land use and productivity — to see where they occur. The data in this app is currently limited to California.
Erosion program
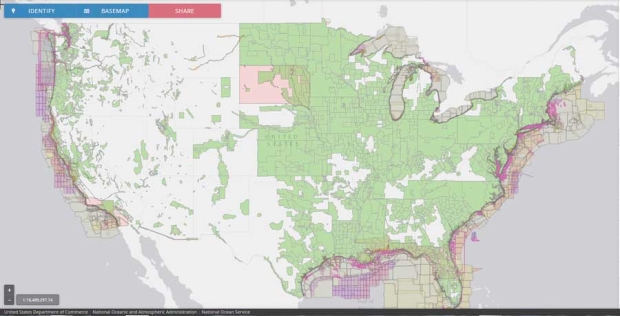
The green regions on this map represent the areas for which LiDAR data is available for use with Agren’s SoilCalculator to create on-farm soil erosion management plans. (Courtesy National Oceanic and Atmospheric Agency)
Anyone who farms on slopes or hills knows erosion is the enemy. An ex-USDA soil scientist who wasn’t satisfied with how his agency determined soil conservation practices for farms made his own more exacting tool.
Tom Buman, owner of Agren Inc. of Carroll, Iowa, founded his company in 2006 to begin building soil conservation software. One of the commercial software modules he developed for agricultural use is called SoilCalculator and is used to create erosion management plans.
Instead of using soil survey data, his program uses LiDAR data. The acronym for Light Detection and Ranging, it is a remote sensing method used to examine the Earth’s surface.
It works similar to sonar, except it uses light instead of sound. Usually done with aircraft, a sensor is mounted on the underside of a plane, which emits a light pulse as it flies over the region it is mapping.
LiDAR map data is public information because it was generated through matching federal funds from USDA and state and local governments.
Its map data covers a surprising amount of the continental United States and a good deal of the regions where fruit is grown.
“It used to take upwards of 30 hours to engineer soil erosion plans,” Buman said. “Now, with the sensor information in hand, it takes only seconds.”
The database will certainly be expanding soon. “Now there are LiDAR sensors that can be attached to drones,” Buman said.
SoilCalculator, which is currently being coded to be tablet-compliant, can be used to create erosion management systems for any kind of agricultural operation. Instead of basing plans from one part of a farm like the federal agencies do, Buman’s program is based on multiple samples taken from farms.
“We use 30-foot-by-30-foot sensor grids to map land parcels,” he said. “This allows us to be able to identify the hotspots on a property, where erosion potential is critical.”
The program shows how erosion is distributed, constructs various scenarios based on conservation practices and cropping methods. It also computes the cost of erosion losses over time.
Buman’s customer base currently lies in Iowa, Nebraska, Minnesota and Ohio. Owing to the extensive LiDAR mapping already accomplished, Buman said, the company will expand to wherever they have customers. •
– by Dave Weinstock
ONLINE
SoilWeb: bit.ly/1MxM2LH
Agren: www.agrentools.com


Leave A Comment